An AI-generated report can read smoothly while giving the wrong impression of the figures. A manager may see a confident recommendation before anyone has checked the source, the comparison or the size of the group being measured.
Before presenting the recommendation, work through the evidence. Confirm what the metric means, check the denominator and decide what the figures support. Then use a clear visual and a short explanation to help the audience make its decision.
These habits connect AI use with data storytelling. The task is to explain the evidence accurately enough for someone else to act, including the limits that could change the decision.
Start with the decision the audience needs to make
A report becomes easier to check when its purpose is specific. An operations manager deciding whether to investigate late deliveries needs a different explanation from a team reviewing how many customer updates it must prepare.
Both readers may use the same order record. One needs the proportion of deliveries that were late and the reasons. The other may need the total number of affected customers. Decide which question you are answering before asking AI to summarise the data.
Write a working decision statement, such as: “We need to decide what further information is required before changing the delivery process.” This keeps an incomplete dataset from being used to justify a change it cannot support.
Work through a small example
The following figures are fictional and were created for this article. They are not MatrixC results, customer data or evidence of a training outcome. For the example, a late delivery means an order delivered after its agreed date, with the same definition applied to both months.
| Reporting period | Completed deliveries | Late deliveries | Late-delivery rate |
|---|---|---|---|
| Month A | 50 | 6 | 12% |
| Month B | 100 | 8 | 8% |
Imagine an unchecked draft says:
Late deliveries rose by 33%, showing that delivery performance deteriorated. Replace the current process immediately.
This is an illustrative draft written for the example. It is not a recorded output from a tested AI product.
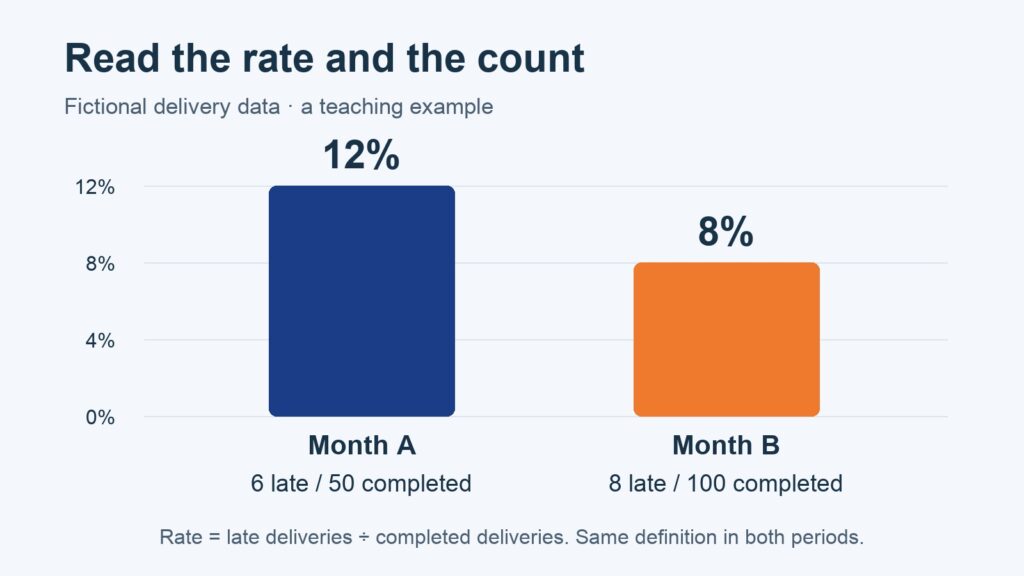
The count did increase: eight late deliveries is two more than six. But the business also completed twice as many deliveries. The late-delivery rate fell from 12% to 8%.
The draft leaves out information needed to judge performance. Its recommendation also goes beyond what this two-month table can establish.
Check the arithmetic and the meaning
The late-delivery rate is the number of late deliveries divided by completed deliveries for the period.
- Month A: 6 divided by 50 equals 12%.
- Month B: 8 divided by 100 equals 8%.
- The difference in rates is four percentage points, calculated as 12% minus 8%.
- The late-delivery count increased by two, or about 33.3% relative to the original six.
Percentage points describe the difference between the two rates. A percentage change describes a change relative to a starting value. State which measure you use so the reader can reproduce it.
The count and the rate answer different questions. Eight late deliveries may still create more customer follow-up work than six. A lower rate can coexist with that higher workload. Keep both visible when the audience needs both.
Do the calculation independently rather than accepting a paragraph because it sounds plausible. A spreadsheet formula or another appropriate calculation tool can help you check the values. The person presenting the report should still understand what was divided by what.
Test whether the comparison is fair
The arithmetic can be correct while the comparison remains misleading. Ask whether both months include the same kind of work and use the same reporting cutoff.
If one month includes completed deliveries only while the other includes open orders, the denominator has changed meaning. If the agreed-date definition changed, the rate may also have changed for reasons unrelated to operating performance.
Look for excluded records, duplicates and missing dates. Consider whether the mix of orders, routes or delivery requirements differs. Two aggregate rates can hide an important problem in one part of the operation.
These checks do not require an elaborate dashboard before the team can learn. They require a clear definition and the willingness to say what is unknown. Record the missing information rather than asking AI to supply a plausible explanation.
Rewrite the recommendation within the evidence
A more careful explanation could read:
In this fictional example, late deliveries increased from six to eight while completed deliveries doubled from 50 to 100. The late-delivery rate fell from 12% to 8%. More late deliveries may increase follow-up work, although the lower rate indicates a smaller proportion of deliveries were late. Check the reasons and order mix before recommending a process change.
This version gives the audience the quantities and the limitation. It does not attribute the change to a cause that the table has not measured.
Two months are also insufficient to establish a sustained trend. A fuller review may need more periods, consistent definitions and information about the causes of delays. Agree what additional evidence would change the recommendation.
AI can help prepare alternative explanations once those boundaries are supplied. Treat each version as a draft for review. Responsibility for the recommendation remains with the people who understand the work and its evidence.
Choose a visual that answers the question
For a simple comparison of late-delivery rates, a two-bar chart can show 12% beside 8%. Start the bar axis at zero and label each period with its count and denominator, such as “6 of 50”. Keep the exact values available in the table.
A chart of late-delivery counts would tell a different part of the story. Label it accordingly. Avoid presenting a count chart under a headline about the rate, or using a dramatic visual scale to overstate the change.
The UK Government Analysis Function’s visualisation guidance recommends establishing the message before selecting a visualisation. Here, the message and the decision determine whether a rate, a count or both belong in the report.
Provide a plain-language explanation so the reader can understand the finding without relying on colour. Check that labels remain readable when the report is viewed on a phone or shared in a meeting.
Use a report-checking worksheet
Before presenting an AI-assisted report, complete these checks:
| Check | Record in the working note |
|---|---|
| Decision and audience | What decision does this report support, and who makes it? |
| Source | Where did the figures come from, and which version is current? |
| Metric | What exactly is counted, over which period and against which denominator? |
| Calculation | Can another person reproduce the result? |
| Missing context | What definitions, exclusions or data gaps could alter the interpretation? |
| Explanation | Does each important statement follow from the evidence? |
| Next action | Who will review the uncertainty or gather the missing information? |
This worksheet can be used as a learning exercise with fictional or appropriately sanitised data. It is not evidence that a report has been audited or that a training course includes a particular assessment.
Build AI judgment and data communication together
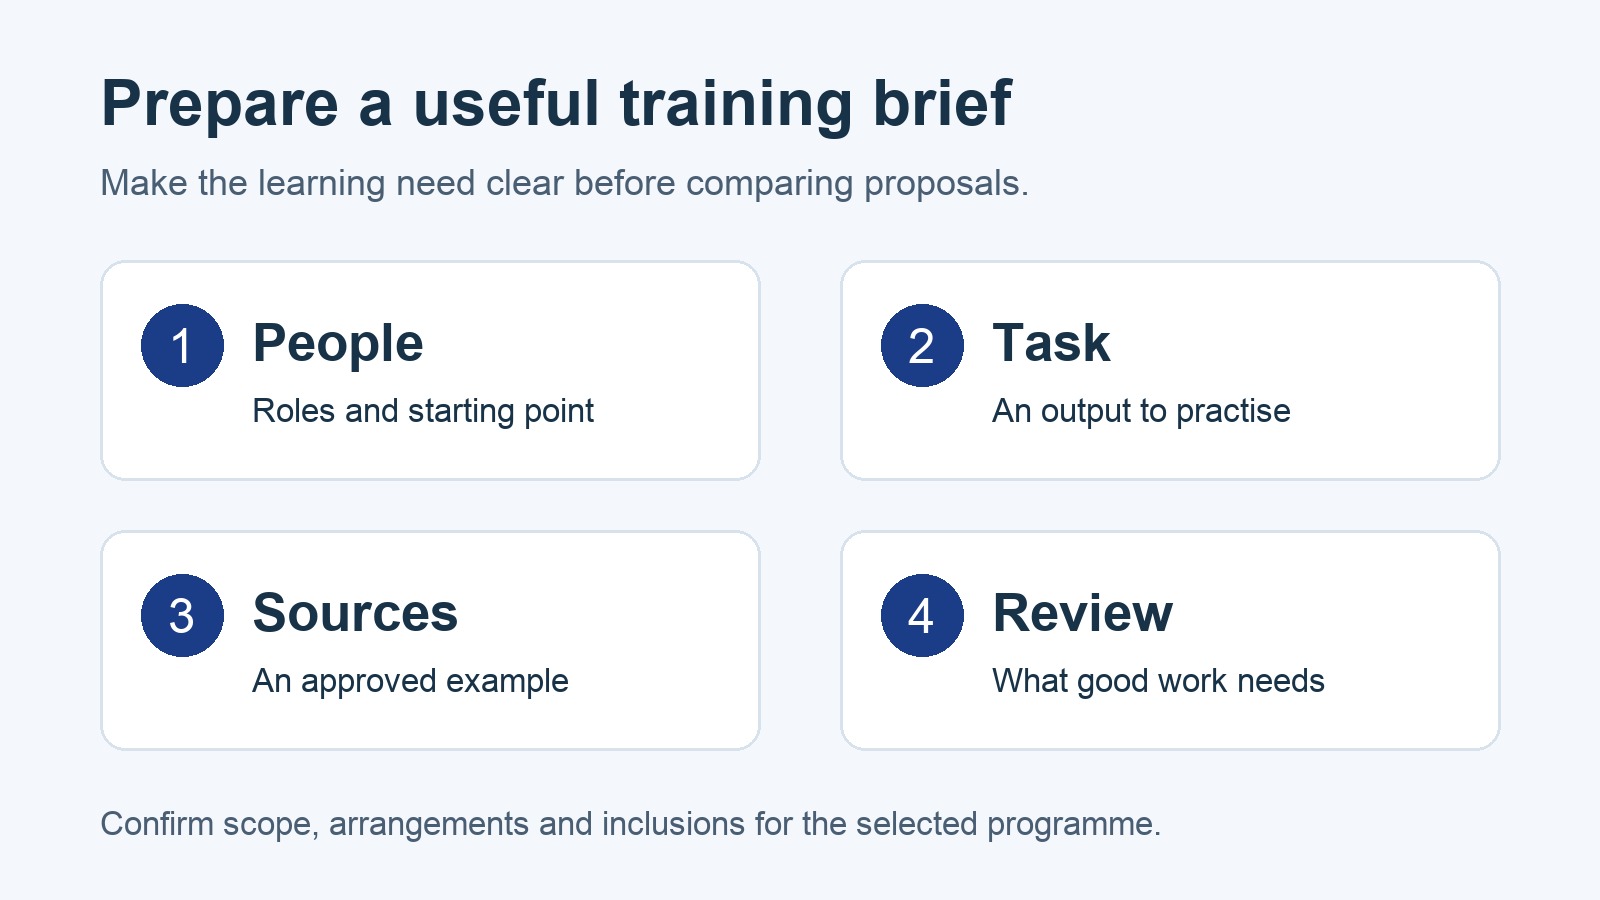
MatrixC Academy brings practical AI use and data skills into the same learning conversation. For teams working on reports and recommendations, explore data skills and storytelling through Enterprise Data Specialist. Review the current outline and starting requirements before selecting a programme.
You can also compare the existing learning paths. If you are ready to discuss a team workshop, use the next guide to prepare a useful brief for a training provider.